
A flat percentage hides the drivers
A brand may budget warranty as one or two per cent of sales without knowing whether that figure reflects its product, channel or service policy. A better model separates claim frequency from cost per confirmed case. Accounting treatment depends on the reporting framework and company facts; finance teams should apply qualified advice.
Define the exposure
Track units sold by model, batch, market and month. Warranty exposure changes as products enter and leave the covered period. A launch with 10,000 recent units has a different risk profile from the same installed base near warranty expiry.
Code the outcome
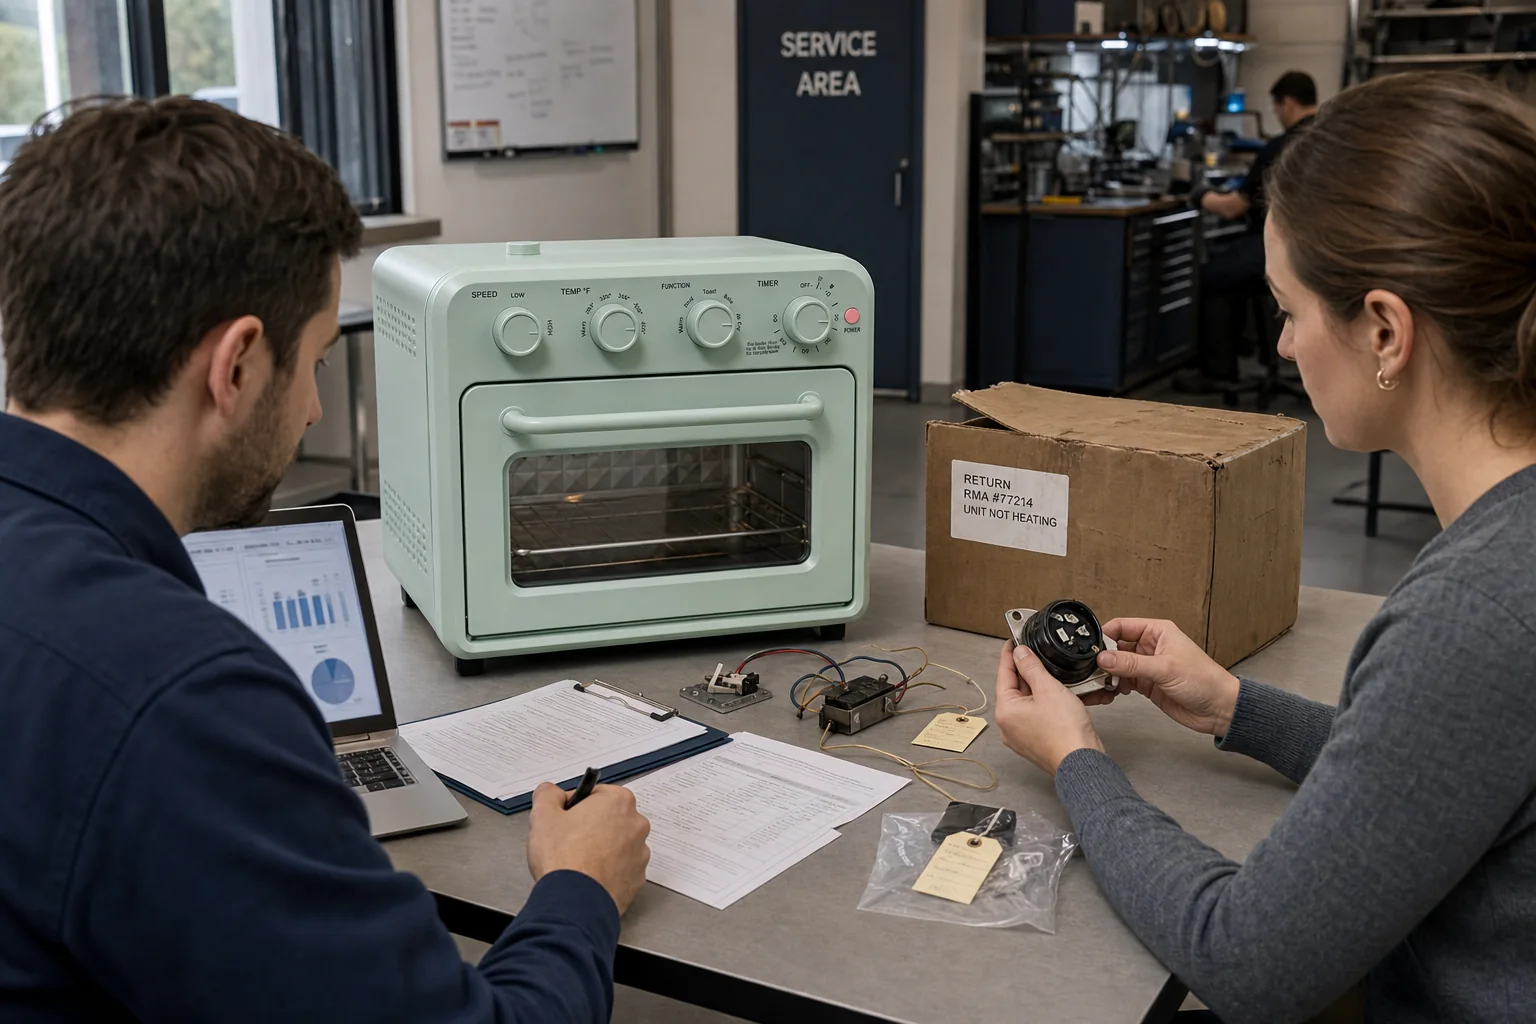
Each claim should record symptom, confirmed cause, no-fault-found status, shipping damage, misuse, manufacturing defect, corrective action and responsible party. Keep replacement, repair, spare part, freight, labour, handling and retailer penalties as separate cost fields.
Use weighted scenarios
For each meaningful failure mode, multiply expected frequency by the cost of its normal remedy. Add operational costs that genuinely follow from the warranty promise. IAS 37 identifies warranties as an example of provisions and requires risks and uncertainties to be considered when measuring an obligation; the exact recognition and measurement decision belongs to the reporting entity.
Feed learning back into the product
A warranty model is not only a finance file. Quality and engineering should review trends by batch, supplier and time in service. ISO 10002 treats complaint analysis as an input to product and service improvement. Update assumptions when evidence changes, but do not erase the history behind previous estimates.
The objective is a traceable model that explains both the number and the actions that can reduce it.
Official references
- [IFRS IAS 37 provisions and warranty obligations](https://www.ifrs.org/issued-standards/list-of-standards/ias-37-provisions-contingent-liabilities-and-contingent-assets/)
- [ISO 10002 complaints-handling guidelines](https://www.iso.org/standard/71580.html)